
Working out your business’s break even point is one of the most crucial formulas to running it sustainably. It can help you understand whether your business is profitable or running at a loss – and helps inform some of key decisions.
Figuring out your break even point can be simple. It’s just a calculation of your costs compared against the money coming into your business. Find out how to make the most of it.
What does break even mean?
To break even means your running costs equal your generated revenues. It’s a metric used to measure if your business is losing money and how sustainably you’re running it.
These costs include everything involved in running your business and selling your product or service, from raw materials to rent and business insurance.
For example, if you were trying to figure out your break even point for your market stall where you sell cookies. Your costs are £100 for the pitching fee, £1 to make each cookie, and you sell them for £3 each.
- For every cookie you sell, you make £3, but it costs you £1 to make
- So, for every cookie, you make a profit of £2 that goes toward paying for the pitching fee
Now, how many cookies do you need to sell, to pay off your £100 pitching fee?
- £100 (your fixed cost) divided by £2 (your profit) = 50 cookies.
Your break even point is 50 cookie sales.Breaking even means your business has neither made nor lost money. But when you do break even, you can expect to start making a profit.
Doing a break even analysis
As part of your forecasts and calculations when starting a business or launching a new product, it’s useful to do a break even analysis.
It’s an accounting tool that works out how much of a product or service you need to sell before you make a profit. Other tools include a balance sheet and a cash flow forecast.
Doing a break even analysis is important. Otherwise you won’t be able to make effective decisions, or set a reasonable price point.
For example, if sales slow down and you don’t know your break even point, it’ll be more difficult to spot that your business will soon have trouble generating profits.
But knowing your break even point will help you work out how to remedy the situation, for example by cutting costs or raising prices.
How to use the break even formula
The break even formula is break even point = fixed costs / (average price – variable costs). It’s a simple way to work out your business’s break even point.
You need to know a few figures to work out your business’s break even point:
- fixed costs – these costs stay the same regardless of how much you sell (e.g. rent)
- variable costs – these costs change depending on how much you sell (e.g. materials), so you’ll need to know the cost per unit sold
- average price – at which you’re selling your products (if you don’t know it yet, you can play around with a few price points as part of your analysis, helping you set one)
Armed with those numbers, you can then use this break even formula:
Break even point = fixed costs / (average price – variable costs)
What are fixed costs?
These costs stay the same, no matter how much you sell.
They’re usually related to a time period, for example a monthly rent payment or a weekly salary for your staff.
If you have high fixed costs, then you’ll need to sell more to break even. But if you can keep fixed costs low, you should be able to navigate periods of sluggish sales more easily.
Fixed costs include:
What are variable costs?
Variable costs change depending on how much you sell.
A clear example is the material used when building products, but other costs can be both fixed and variable.
For example, full-time staff are usually paid the same each month, according to their contract. But if they need to work overtime to deliver a product or service, any extra pay is a variable cost.
The nature of variable costs make them difficult to calculate, so it’s important to keep track of them accurately.
Working out your business’s break even point is one of the most crucial formulas to running it sustainably. It can help you understand whether your business is profitable or running at a loss – and helps inform some of key decisions.
Figuring out your break even point can be simple. It’s just a calculation of your costs compared against the money coming into your business. Find out how to make the most of it.
What does break even mean?
To break even means your running costs equal your generated revenues. It’s a metric used to measure if your business is losing money and how sustainably you’re running it.
These costs include everything involved in running your business and selling your product or service, from raw materials to rent and business insurance.
For example, if you were trying to figure out your break even point for your market stall where you sell cookies. Your costs are £100 for the pitching fee, £1 to make each cookie, and you sell them for £3 each.
- For every cookie you sell, you make £3, but it costs you £1 to make
- So, for every cookie, you make a profit of £2 that goes toward paying for the pitching fee
Now, how many cookies do you need to sell, to pay off your £100 pitching fee?
- £100 (your fixed cost) divided by £2 (your profit) = 50 cookies.
Your break even point is 50 cookie sales.
Breaking even means your business has neither made nor lost money. But when you do break even, you can expect to start making a profit.
How to use the break even formula
The break even formula is break even point = fixed costs / (average price – variable costs). It’s a simple way to work out your business’s break even point.
You need to know a few figures to get started:
- fixed costs – these costs stay the same regardless of how much you sell (e.g. rent)
- variable costs – these costs change depending on how much you sell (e.g. materials), so you’ll need to know the cost per unit sold
- average price – the price you’re selling your products (if you don’t know it yet, you can play around with a few price points as part of your analysis, helping you set one)
What are fixed costs?
These costs stay the same, no matter how much you sell.
They’re usually related to a time period, for example a monthly rent payment or a weekly salary for your staff.
If you have high fixed costs, then you’ll need to sell more to break even. But if you can keep fixed costs low, you should be able to navigate periods of sluggish sales more easily.
Fixed costs include:
What are variable costs?
Variable costs change depending on how much you sell.
A clear example is the material used when building products, but other costs can be both fixed and variable.
For example, full-time staff are usually paid the same each month, according to their contract. But if they need to work overtime to deliver a product or service, any extra pay is a variable cost.
The nature of variable costs make them difficult to calculate, so it’s important to keep track of them accurately.
To work out total variable costs, focus on how much it costs to make one unit, then multiply that by total units produced:
Total variable cost = total units produced x variable cost per unit of output
Variable costs include:
- shipping
- utilities that change depending on usage
- packaging
- transaction fees
- commission and overtime
Creating a break even graph
A break even graph helps you visualise how long you’ll be making a loss for, your break even point, and eventual profitability.
It’s fairly simple to create a break even graph once you’ve worked out your costs and know your price.
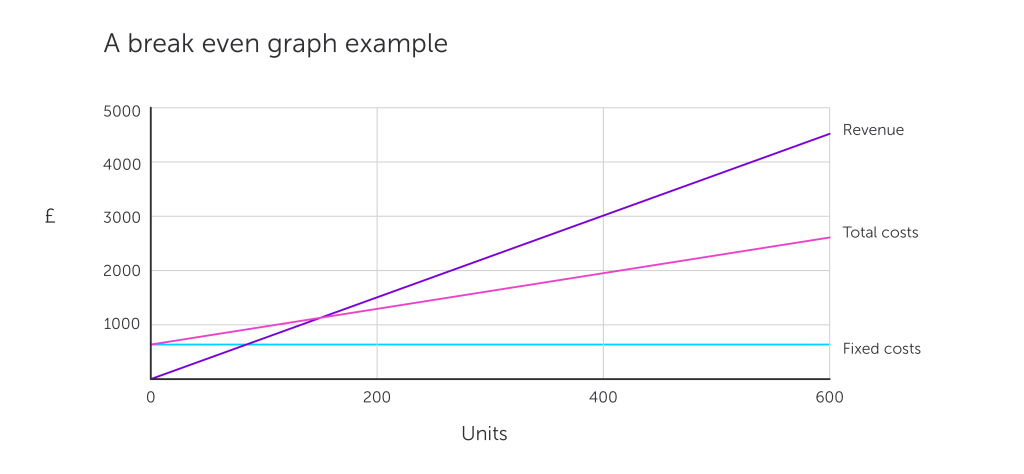
The horizontal (X) axis shows your output in units, while the vertical (Y) axis shows your costs and revenue.
You plot a straight horizontal line of fixed costs across the graph, as these don’t change with the number of units produced.
Then you plot a line for variable costs, starting at the point fixed costs start. This line represents total costs.
So if total variable costs for 600 units are £2,000, mark that point on the graph and draw a line upwards starting from the fixed costs line on the Y axis.
Finally you plot a line for total revenue. You need to multiply the price by the total number of units – if you’re planning on selling 600 units at £7.50, total revenue will be £4,500. Mark that point on the graph and draw a line from 0 on the Y axis upwards.
Where the two lines cross is your break even point.
In this example:
- the price is £7.50 a unit
- variable costs are around £3.33 a unit (total £2,000)
- fixed costs are £600
- sales are projected at 600 units
- total revenue is projected at £4,500
- the break even point is just over 143 units
Creating a break even graph
A break even graph helps you visualise how long you’ll be making a loss for, your break even point, and eventual profitability.
If you’re wondering how to draw a break even chart, it’s fairly simple once you’ve worked out your costs and know your price.
The horizontal (X) axis shows your output in units while the vertical (Y) axis shows your costs and revenue.
You plot a straight horizontal line of fixed costs across the graph, as these don’t change with the number of units produced.
Then you plot a line for variable costs, starting at the point fixed costs start. This line represents total costs.
So if total variable costs for 600 units are £2,000, mark that point on the graph and draw a line upwards starting from the fixed costs line on the Y axis.
Finally you plot a line for total revenue. You need to multiply the price by the total number of units – if you’re planning on selling 600 units at £7.50, total revenue will be £4,500. Mark that point on the graph and draw a line from 0 on the Y axis upwards.
Where the two lines cross is your break even point.
In this example:
- the price is £7.50 a unit
- variable costs are around £3.33 a unit (total £2,000)
- fixed costs are £600
- sales are projected at 600 units
- total revenue is projected at £4,500
- the break even point is just over 143 units
An example of a break even graph.
Why is understanding your break even point important?
Using this formula can help you make more informed decisions in your business, like:
- deciding whether to launch a new product or service
- seeing what you need to sell to make a profit
- analysing different price points and how much you might make at different levels of output
- working out whether you need to reduce costs to lower the break even point (or raise prices as a result of inflation)
- getting finance from your bank or other investors
But try not to make your calculations unrealistic and make sure you keep on top of variable costs. They can change often, which quickly makes your break even analysis inaccurate.
Break even also predicts that you’ll sell a set number of your product or service at the same price. So you’ll need to update your analysis as your business’s situation changes.
Break even point FAQs
What’s the difference between fixed and variable costs?
The difference is fixed costs are business expenses that remain constant, regardless of things like rent, insurance, or full-time staff salaries. variable costs fluctuate depending on the amount of products or services sold.
Why is break-even analysis a useful business tool?
A break-even analysis helps businesses understand what it takes for their business to become profitable, assist with decision-making, and help set prices.
Ready to set up your cover?
As one of the UK’s biggest business insurance providers, we specialise in public liability insurance and protect more trades than anybody else. Why not take a look now and build a quick, tailored quote?