It can be difficult to understand what is going on under the hood in the Docker Build process, especially in complex multi-stage builds. There are many solutions available for observing running Docker containers, but limited options for observing Docker builds.
Context
The time required to build the Docker image for our core software product at Simply Business has been slowly creeping up over the years. The application tooling team was tasked with optimising our Docker images for faster build times. This would reduce the time it takes to deploy code to production, speed up feedback cycles for code under development, and we thought it might impact developer happiness too.
The problem
Measuring improvement is not straightforward
There are several reasons why simply measuring total build time for Docker images is not granular enough for our use case. We use several different caching strategies, and have network variability and other random sources of latency to account for, which combined can cause significant fluctuations in build times.
Let’s look at a super simple example that illustrates this:
Original Dockerfile
FROM scratch
COPY / .
# do some other stuff...
CMD [“echo”,”Image created”]
Optimised Dockerfile
FROM scratch
COPY /lib .
# do some other stuff...
CMD [“echo”,”Image created”]
Instead of copying the whole directory COPY / ., we are now only copying a subdirectory lib with the files we care about onto our final image. The time wasted copying over tests, scripts and assets has been saved. However, since we are using Docker’s built-in layer caching, we’ll get cache misses starting from the second line all the way to the end of the file. This means on the first run, the optimised image may take longer to build than the original! No problem, we can just run the build a second time; we’ll get all the advantages of caching this time. But wait, the build now takes almost no time at all, because we have not made any changes to our image on rerun, so we are getting cache hits for every single step. This is the optimal scenario but doesn’t reflect the much more common scenario where some part of the image has changed. We’ve made an optimisation that we think should improve our build speeds, but can’t actually measure or even validate this improvement.
The strategy
Improve monitoring and observability
We wanted a more granular view of our Docker build times. Instead of looking at the overall time to build a complete image, we care much more about comparing the time to execute a single layer. And rather than looking at the times for a single build run, we are much more interested in the normative average across several production builds. Fortunately, Docker BuildKit offers some snazzy features for improved observability using Jaeger and the OpenTracing specification. However, many parts of BuildKit are still under development, and implementation was not straightforward.
Gotcha #1: using buildctl
At the time of writing, OpenTracing in BuildKit is supported only with buildctl or gRPC calls to the BuildKit daemon. We were not able to view traces using our docker-compose configuration or even the standard docker build ..
Gotcha #2: running the BuildKit daemon
OpenTracing also requires that the BuildKit daemon (buildkitd) is running. However, buildkitd is currently only runnable on Linux systems. The majority of Simply Business engineers do their local development on MacOS, so this was our biggest barrier to successfully accessing Opentraces. We hacked around this by using Docker in Docker as a substitute Linux VM.
Gotcha #3: Jaeger tight coupling
The OpenTracing BuildKit feature is tightly coupled to Jaeger as a visualisation tool (even though the OpenTracing specification is vendor agnostic). At Simply Business, we prefer to consolidate our monitoring services as much as possible for simplicity. To extract the data and import it in a different visualisation tool, we used the Jaeger JSON API.
Going forward
Keep an eye on the BuildKit Docs for updates. As BuildKit features mature, many of these pain points may get resolved.

The Solution
A step-by-step guide for viewing Opentraces from Docker builds in Jaeger
1) Run Linux
If you’re already running on a Linux system (most distributions are fine), congratulations! You can skip this step.
If you’re running Windows or MacOS, you can use the Docker in Docker image.
docker run -it --privileged --name docker-in-docker -d -p 16686:16686 docker:dind
container_id=`docker ps -aqf "name=docker-in-docker"`

# copy the project into that container
docker cp . $container_id:/


# enter the docker-in-docker container
docker exec -it $container_id /bin/sh
Notice we need to expose port 16686 to access the Jaeger dashboard. This will make more sense after Step 2.
All the steps going forward should be run from inside the Docker in Docker container unless stated otherwise.
2) Run Jaeger
docker run -e JAEGER_DISABLED=true -d -p6831:6831/udp -p16686:16686 jaegertracing/all-in-one:latest
export JAEGER_TRACE=0.0.0.0:6831
The JAEGER_DISABLED=true flag prevents Jaeger from creating its own traces that will clutter up the dashboard. The -p6831:6831/udp flag sets the listening port in Jaeger for receiving OpenTrace data, and -p16686:16686 sets the output port for viewing the Jaeger dashboard. For a quick general overview of Docker binding ports, see this guide. The export JAEGER_TRACE=0.0.0.0:6831 command specifies the same listening port to tell BuildKit where to publish the data.
3) Install Docker BuildKit and run the BuildKit daemon
# install BuildKit
wget https://github.com/moby/buildkit/releases/download/v0.7.2/buildkit-v0.7.2.linux-amd64.tar.gz
tar xvfz buildkit-v0.7.2.linux-amd64.tar.gz

# run BuildKit daemon (in the background)
./bin/buildkitd &
4) Build the image
./bin/buildctl build \
    --frontend=dockerfile.v0 \
    --local context=. \
    --local dockerfile=.
The --frontend flag specifies how to convert the build definition into the intermediate binary (called an LLB) that BuildKit expects. The --local flag exposes local files from the source to the builder, and both context and dockerfile are required. It is also possible to optionally pass build arguments with the --opt flag:
--opt build-arg:foo=bar5) View results
View the traces in the browser at localhost:16686 or extract them via the JSON API. If you’re running Docker in Docker, this is accessible from outside the container.
curl http://localhost:16686/api/traces?service=buildkitd | jq '.data'The complete script
# run parent docker container (hack so we have a linux system)
docker run -it --privileged --name docker-in-docker -d -p 16686:16686 docker:dind
container_id=`docker ps -aqf "name=docker-in-docker"`

# copy the project into that container
docker cp . $container_id:/

# enter that container
docker exec -it $container_id /bin/sh

# install and run jaeger listener
docker run -e JAEGER_DISABLED=true -d -p6831:6831/udp -p16686:16686 jaegertracing/all-in-one:latest
export JAEGER_TRACE=0.0.0.0:6831

# install BuildKit
wget https://github.com/moby/buildkit/releases/download/v0.7.2/buildkit-v0.7.2.linux-amd64.tar.gz
tar xvfz buildkit-v0.7.2.linux-amd64.tar.gz

# run BuildKit daemon (in the background)
./bin/buildkitd &

# build the Dockerfile using buildctl
./bin/buildctl build \
    --frontend=dockerfile.v0 \
    --local context=. \
    --local dockerfile=.
The results
Analyzing Opentraces
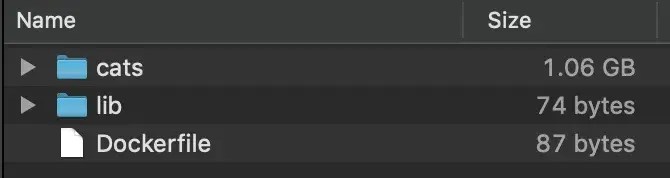
Revisiting the original example, we can now view the Jaeger dashboard at http://localhost:16686/ and understand exactly how much impact our optimisations have. Just to illustrate the point, we used a project with a very small lib/ folder and included an additional 1 Gigabyte of cat photos in a different subdirectory*.
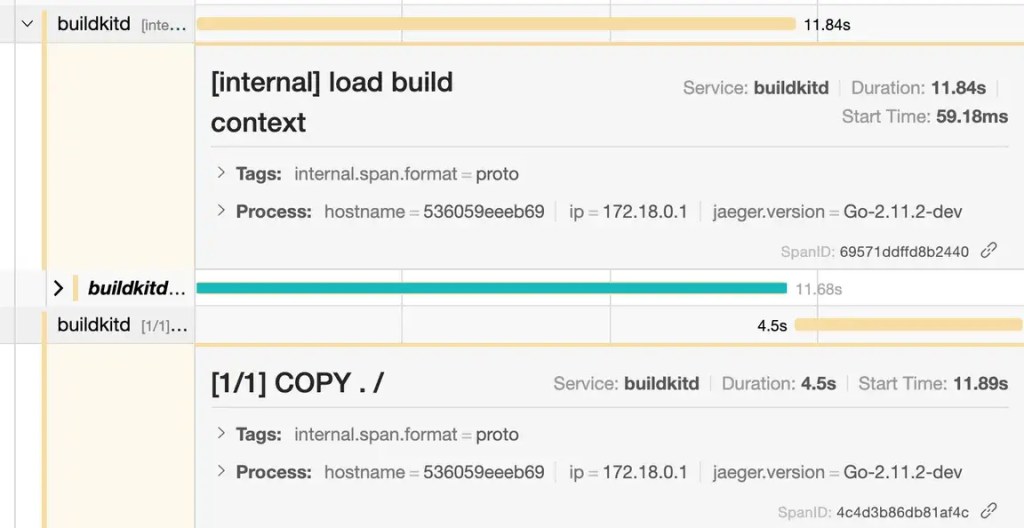
In the original Dockerfile, Jaeger tells us that the COPY . / layer took 4.5 seconds to build, and was only able to start after the build context had loaded, which took 12 seconds. The overall build of this ultra-simple 3 line Dockerfile took about 17 seconds.
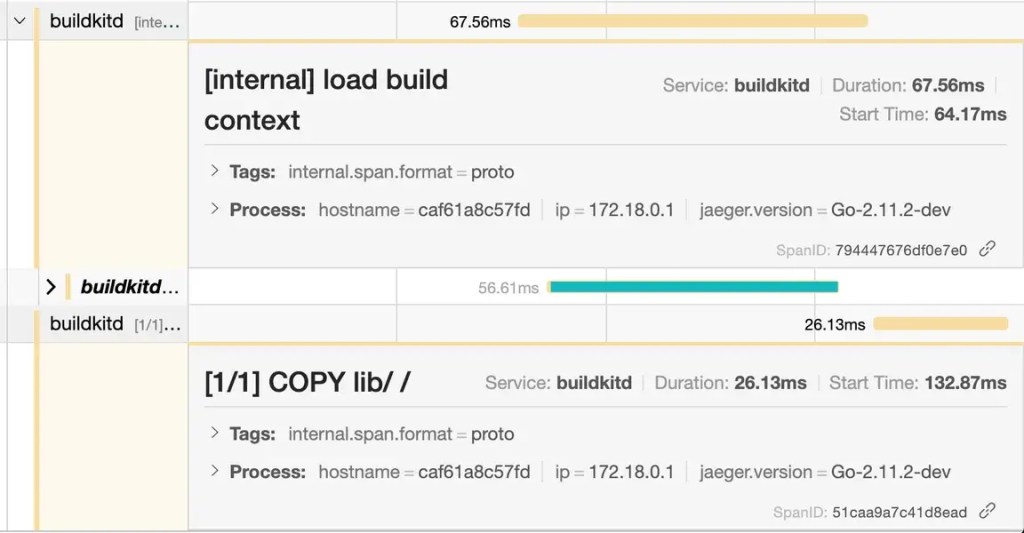
After reducing the volume of data to copy over, Jaeger traces show the new command COPY lib/ / took only 26 milliseconds. Even more significant is that loading the build context took less than 0.2 seconds. Total build time was 0.3 seconds.
Both of these builds were run after clearing all Docker internal caches (Docker in Docker made it easy to restart the container and start from scratch). Therefore, these numbers represent worst-case-scenario build times.
Obviously, for this trivial example we don’t need the granularity of OpenTracing to see that we’ve made improvements. However, it does help us measure and understand exactly what has improved and by how much. In a significantly more complex Docker configuration with multiple stages and many more layers, these insights become invaluable.
* In real life these might be replaced by testing scripts or assets. Or you may just have a lot of cat photos. We don’t judge.
Ready to start your career at Simply Business?
Want to know more about what it’s like to work in tech at Simply Business? Read about our approach to tech, then check out our current vacancies.
We create this content for general information purposes and it should not be taken as advice. Always take professional advice. Read our full disclaimer