How much does cold-start really impact a serverless architecture with AWS Lambda? Let’s answer with some figures.
AWS Lambda has been around for a while and it has massively grown in popularity since a few colleagues and I tentatively used it in a Simply Business hackathon in 2016. Fast forward to 2019, and Lambda is a recognised tool in our tech production stack, used for more and more complex tasks.
Something that doesn’t seem to have changed is the public discourse around Lambda cold-start – the problem is feared and whispered about, but seemingly not well understood. This post is an attempt to bring data into the conversation and get some clarity to make better decisions on Lambda architectures in production.
What is the cold-start problem?
A Lambda function runs on top of some virtual infrastructure. Before the handler code can be executed, the infrastructure has to be set up: a container needs to be provisioned, code and dependencies need to be copied onto it and other startup operations need to happen. This is known as a cold-start.
The set up work doesn’t really need to happen every time the function is invoked: when it doesn’t happen, we have a warm-start.
There are 3 main scenarios when a cold-start can happen:
- A new version of a function is deployed
- A new instance of the function is provisioned (e.g. when concurrency scales up)
- A certain amount of time has elapsed (shorter if the function is idle, longer if the function is regularly invoked)
The last point is the one we as developers have the least amount of control over, and many different people have run experiments to try and pin a figure against it. For our purposes, let’s just say that cold-start is unavoidable and frequent enough to have an impact on your response times.
The question is, what kind of impact does it have, and is it acceptable for your application? This is what I tried to look into.
A starting point
The best example I could find of a data-minded approach to the cold-start problem was this 2017 post by Yan Cui: How does language, memory and package size affect cold-starts of AWS Lambda?
The main conclusion of the post was that memory size improves cold-start time linearly. This seemed like a promising starting point, but 2017 is ancient history, when compared to the speed of innovation within AWS services. Ruby was not supported at the time (it is now) and the maximum amount of memory available to a Lambda was 1.5Gb (it is now 3Gb and has been for a while).
Experimenting
I started off from the code for Yan’s experiment and extended it to include Ruby, higher memory options and the effect of a VPC on cold-start (which I’ll talk about in a future post). When I ran it, I was indeed able to replicate Yan’s results. Something felt off, however: the figures I was getting from CloudWatch for Lambda execution time were quite a lot smaller than what we were seeing when calling a Lambda function in a browser, especially when cold-start was involved.
Puzzled by the results, I built increasingly complex scenarios and ran the experiment against all the measuring tools I could find. They all seemed to confirm the initial hunch: CloudWatch wasn’t telling the whole story, when reporting on a Lambda execution time.
What to measure
My original experiment was looking at the duration as reported by CloudWatch. This is what you can see in the “Monitoring” tab of your Lambda function in the AWS console.
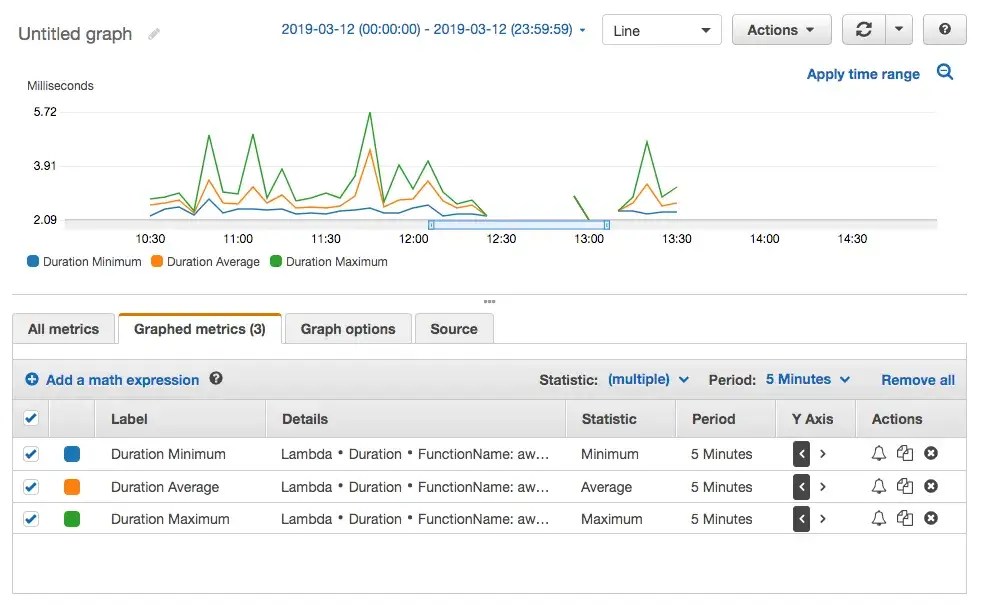
As an interesting aside: CloudWatch generates the graph above from the individual durations logged by each function. You can easily see them in CloudWatch Logs, along with other useful metrics.

However, I’ve already mentioned that the figure reported by CloudWatch didn’t seem to be enough to understand what was going on with cold-start.
Fortunately, AWS provide a tool to get insights into invocations or requests across multiple resources (e.g. an API Gateway request, resulting in a Lambda invocation, which triggers a DynamoDB query): X-Ray.
In our case, we’re only interested in one resource (our Lambda function) but we can still benefit from X-Ray in two major ways: we can measure how long the whole invocation takes, and we can dig deeper into the phases of the invocation.
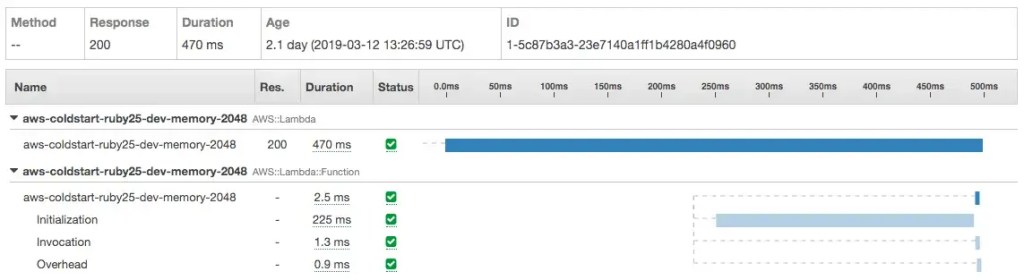
In the example above, we can see X-Ray reporting on the total duration of the function invocation (470ms, labeled AWS::Lambda). We can also see how long it took to execute the function (2.5ms, labeled AWS::Lambda::Function), which is the equivalent of the CloudWatch duration I mentioned earlier.
Finally, we can drill down into various phases of the invocation, of which Initialization (225ms) is the one we care about. Invocation and Overhead are, interestingly, only available for Ruby functions and they’re already included in the execution time.
So, I enabled X-Ray for my functions and I started collecting data around four metrics:
- “Total duration”, as reported by X-Ray in the
AWS::Lambdasegment. - “Execution” as reported in the
AWS::Lambda::Functionsegment. - “Initialization” as reported in the
Initializationsubsegment. This represents how long it took to execute the code before the function handler itself. - “Setup”, finally, as a derived metric:
Setup = Total duration - Initialization - Execution. It’s the time spent outside of executing the function and it’s most likely related to cold-start operations such as spinning up a new container, copying the code and so on.

Results
Let’s look at the results for Ruby and Node, which are the most interesting languages for us in Simply Business.
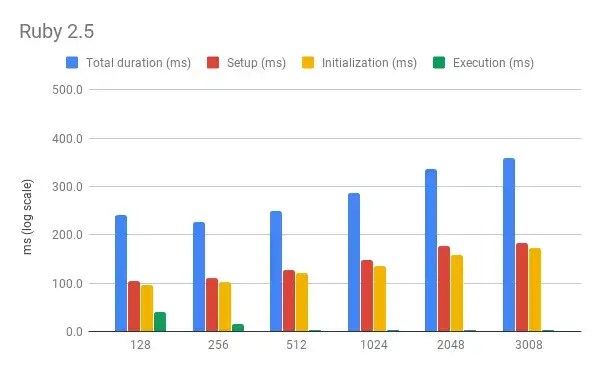
Here’s a chart for Ruby 2.5:
And here’s a very similar one for NodeJS 6:
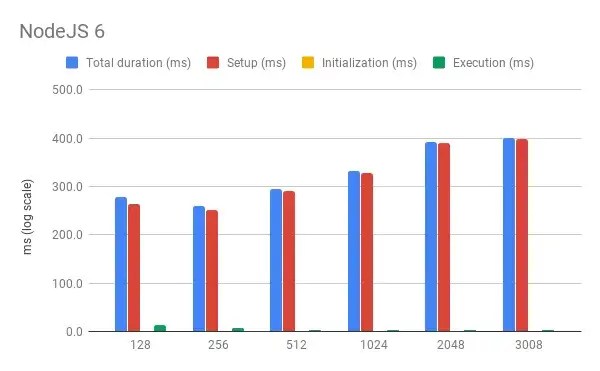
What’s immediately obvious is that the distribution of time across various phases is different for different languages. Node requires pretty much no Initialization time and most of the time is spent in the Setup phase. Ruby, on the other hand, is split almost 50-50 between Setup and Initialization.
For both languages (Node especially) Execution time accounts for only a small portion of the total. This makes sense, as the handlers are not really doing much and so are dwarfed by the time it takes to Setup and Initialize the function (i.e. the cold-start time).
If we only look at Execution time, the pattern across different memory options corroborates the findings in Yan’s original post: more memory means faster execution.
However, if we look at Total duration, the picture is quite different: in this case, more memory means slower execution. A possible explanation is that reserving a bigger slice of memory takes longer, either because of processing time or because we end up waiting longer for the resource to become available in the AWS pool.
As an aside, note that there is a dip in the chart when memory is 256Mb. It’s an interesting oddness, but I’d argue that the effect is not strong enough to draw any conclusions.
Conclusions
This leads us to a few interesting conclusions:
- A cold-start on Ruby 2.5 or NodeJS 6 adds on average 300ms to the invocation time
- The Execution time for a Lambda function doesn’t tell the whole story, especially when a cold-start happens
- Similarly, X-Ray subsegments don’t tell the whole story: they leave out Setup time, which is especially relevant for cold-start scenarios
- Configuring a Lambda function with more memory means two things:
- More memory makes the cold-start penalty worse
- More memory makes the Execution time better
Note that Lambdas doing real work will have a higher execution time than my trivial handlers: adding more memory will benefit real Lambdas by reducing their execution time and my assumption is that the saving in execution time will more than compensate the penalty in cold-start time.
Also note that these conclusions only apply to Ruby and NodeJS. If you’re using a different runtime, especially one based on a compiled language, your mileage may vary.
Open questions
As with anything in life, diving deep into a subject is bound to raise more questions than answers. Here are a few avenues of inquiry for the future, based on my experience with this experiment:
- Testing again with realistic code in the handler and measuring the inflection point when the benefits to execution time are greater than the penalties to cold-start time
- Measuring Setup and Initialization time for warm-starts
- Figuring out whether all Lambdas are already running on AWS Firecracker and, if not, what its impact is going to be
- Looking deeper into the distribution of data, as opposed to just looking at averages
I’d also be curious to find out why a small portions of the X-Ray traces the experiment generated were missing an AWS::Lambda::Function segment or an Initialization subsegment. This was tiny (about 0.2% of the total), but still, it was surprising.
And finally, a recent post by Yan Cui hinted at changing an environment variable to ensure a cold-start happens: that may be a better approach than the one I used in this post, which requires a full redeploy of all functions. Something to look into for future experiments.
References
Ready to start your career at Simply Business?
Want to know more about what it’s like to work in tech at Simply Business? Read about our approach to tech, then check out our current vacancies.