At Simply Business, the Data & Analytics team has designed and built an internal application for monitoring live data experiments to help us track and share insights on our products and customer experience. Learn more about how we achieved this and why self-serve analytics tools can help teams to iterate more quickly while learning new skills.
Key drivers for monitoring data experiments
Simply Business is a data-driven technology company, which means we are constantly experimenting in order to improve our products and customer experience. As we grow as a company, both in the UK and the US, the number of experiments that are live at any time is also growing. We’ve already taken steps to improve the communication between product teams to keep on top of the number of experiments and to share learnings by creating a cross-team forum called The Lab. You can hear our Head of Insight (UK) speak more about this in our video link: Building The Lab.
Within the Data & Analytics team, our insight analysts each support multiple product teams and therefore can be juggling many live experiments at once. As we continue to scale, this may become unsustainable, hence the need for a tool that allows the monitoring of experiments by business owners. The need for greater visibility over live experiments also fits with the Data & Analytics team’s mantra – to empower the business by providing self-serve analytics tools. We already use Looker and OLAP data cubes for this.
Solution requirements
When considering our requirements, the Data & Analytics team at Simply Business decided to build something internally rather than purchasing an off-the-shelf solution. This gives us a few advantages:
- The tool can be completely flexible in terms of the features we want to build; for example, we were already analysing our test results using a Bayesian approach written in Python – this is something that could easily be built-in here
- We’re able to integrate the tool with our other internal systems without too much difficulty
- We don’t have to pay an external company for hosting this service for us
- We’re likely to be able to iterate much faster when we need to make changes as we won’t need to rely on a third party
- Our team is empowered to learn new skills which means they are happier!
Every good application needs a name, so we’ve named ours “Dexter”, inspired by a certain boy-genius cartoon character who has a secret laboratory in his bedroom. It even has its own internal logo.
Technical implementation
Dexter is built using the Flask web framework (written in Python) – this was a fairly obvious choice for us because the analysts are already using Python for data analysis on a regular basis. Therefore, the use of Flask would allow this group to own, maintain and improve Dexter as they require, as well as re-use the functions we’ve already written. Additionally, other members of the data team have already created internal applications using Flask so we have a wealth of knowledge and support available.
When approaching the task, we first had a session to discuss the features we needed (or wanted) Dexter to have. These were framed as user stories and our backlog was created and sorted into categories:
- MVP (minimum viable product) – the bare minimum we could create to deliver some value
- 2.0 – features that are useful but not essential for phase 1
- Keep Dreaming – features that would be amazing to have but are either very complex to build or are dependent on external factors (e.g. would require input from other teams). To help us validate our ideas, our wonderful product design team created an interactive prototype to bring the dream to life in a way that was elegant and gave us something to aim towards when building out Dexter. After ironing out these two crucial steps, we were able to start development of the MVP features.
Following the design of the prototype, our MVP needed two essential functions to be met to start providing value:
- An analyst must able to add a new test into the system.
- A test owner (usually a product manager) must be able to view the results of a test independently.
We used WTForms to construct a simple form that an analyst could use to input the key details of a test, including owner, start and end dates, primary metric name and, possibly most importantly, a SQL query that would retrieve the results from our database. WTForms also includes useful functions such as form validation, which we used in our solution. To create a nice looking front-end for the form (and the rest of the app), we used Bootstrap.
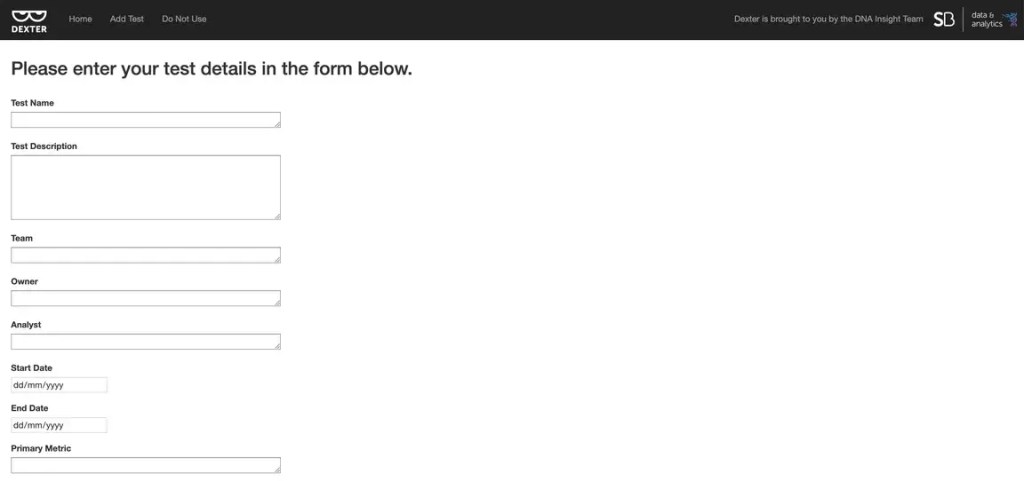
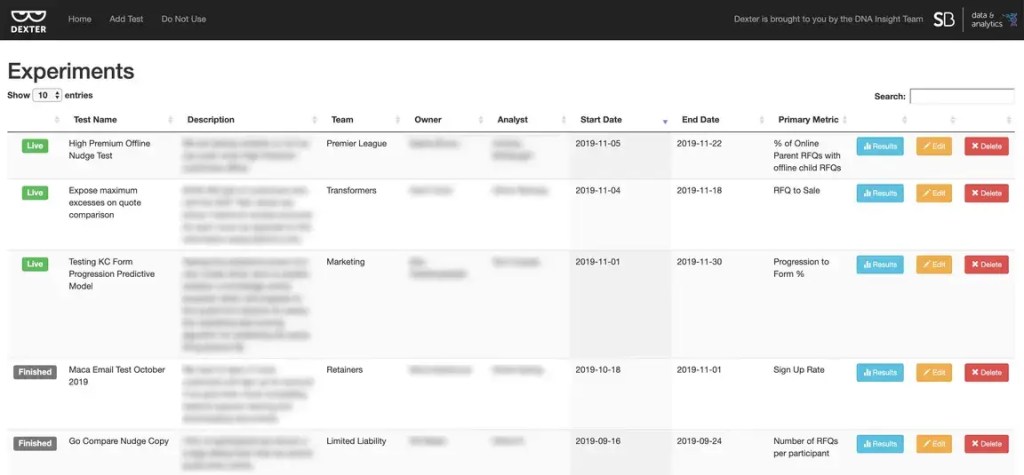
In our design, once the form is completed and the user clicks submit, the SQL query is run against the database to check that it returns coherent results. If it passes this test (and a few others), the test is stored in a table in our data warehouse Snowflake, with all the input details submitted via the form. The homepage then displays all the experiments that exist in the Snowflake table.
The basis of the homepage is the table of experiments, which has a user friendly interface thanks to the DataTables jQuery plug-in. This amazing tool was really simple to implement and brings a wealth of built-in features such as search and sorting. Since we wanted our users to get the most value out of Dexter, it was really important to make it as easy to use as possible. There are loads of plug-ins similar to DataTables out there; this article gives a useful summary of some of them.
To enable the users to view the results of their experiments, the table includes a Results button for each experiment, which uses a jQuery click function to open a modal to display these. Behind the scenes, here’s what happens:
- The button triggers an AJAX call to the server which then retrieves and runs the SQL stored for that particular experiment.
- It then kicks off a Python script which runs the statistical tests and returns the results in a friendly format.
- Whilst this is executed, and because user happiness is at the heart of Dexter, we put a cute dog GIF in the modal to entertain the user whilst the app retrieves the results.
- Once the results are ready, and returned back to the UI, the user will see a headline of the experiment statistical significance and run-time, plus an overview of the primary performance metric for each branch and several statistical graphs (for those who like a deeper dive).
As with our other internal applications, the code is version-controlled in GitHub. Also, to make development and testing easier for any contributor, it can be run locally using Docker without any other dependency. For live production deployment we use Jenkins.
Next steps
The main users of the app thus far are Simply Business insight analysts and product managers. We’re able to monitor usage by using Looker and will be collecting regular feedback from users in order to make sure that Dexter is providing the most value it can.
In this article, we’ve outlined the workings of the bare bones of our data experiment monitoring application – Dexter. In reality, our app uses many more features than those described above (including a rickroll button). The Data & Analytics team has big plans for Dexter – it’s the foundation piece that will allow us to improve our future testing and analytics services and capability at Simply Business.
Ready to start your career at Simply Business?
Want to know more about what it’s like to work in tech at Simply Business? Read about our approach to tech, then check out our current vacancies.
We create this content for general information purposes and it should not be taken as advice. Always take professional advice. Read our full disclaimer