It is considerably more difficult to measure the impact of offline marketing campaigns than online digital ones. Here we describe how we use some simple maths, some clever SQL, our open source Snowplow analytics system and our Looker data discovery tool to measure the success of regionalised radio ads and to help us decide where best to spend our money next.
The Objective – Testing the Airwaves
Here at Simply Business, we are working hard to make business insurance easier to understand and simpler to buy. We are keenly focused on the small business sector in the UK, which represents an incredibly diverse community of some 5 millions SMEs, each with their own individual needs.
We have great success communicating with this community through digital channels like online search, display advertising and social, but in recent months we have been testing regionalised radio advertising to open up a more traditional “above the line” conversation.
The Requirement – Did Radio Kill the Internet Star?
As an online tech business, this has been somewhat new ground for us and we wanted to make sure that we could measure the impact of these tests in a way that gave us insight into the dynamics of this channel. We have a cutting-edge data pipeline that allows us to see and analyse individual user journeys with tremendous clarity. It was important that any metrics that we used for our radio tests could be closely aligned with these user journeys so that we could understand the impact of radio side-by-side with our more well-understood digital channels.
The challenge was to determine whether a visitor to the site was likely to have heard our radio ad or not, and to do that we needed to be able to assign each visitor to a highly customised geographic segment that closely represented the broadcast area for each of the stations the ad ran on.
This kind of in-depth, highly specific data mining cannot be supported by canned reporting tools like Google Analytics. Fortunately, we had implemented Snowplow for event tracking, and we already had both our web traffic raw data and our granular sales data ready in a Redshift database so that we could cut it anyway we needed to. With Looker sitting on top of Redshift, we had the necessary tools to visualise and present the insight too.
The Solution – Building Up the Tempo
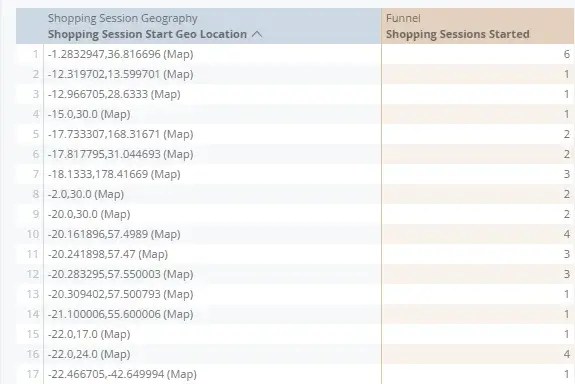
As part of the data pipeline, we had already enriched each visit with geographic co-ordinates of the visitor based on their IP address. The hard part was to determine whether the resulting geolocation was within earshot of the radio station or not, and then create meaningful customer segments that we could compare with behaviour in other channels.
Originally, we experimented with ways of assigning visits to commonly available geographic locations, such as polygons based on postcodes or voting districts. This raised two problems:
- The algorithms for determining whether a postcode was within a geographic area represented by a complex polygon would have entailed significant crunching and complexity
- The areas we had to hand, such as voting districts, didn’t map that closely to the actual reach of the radio station.
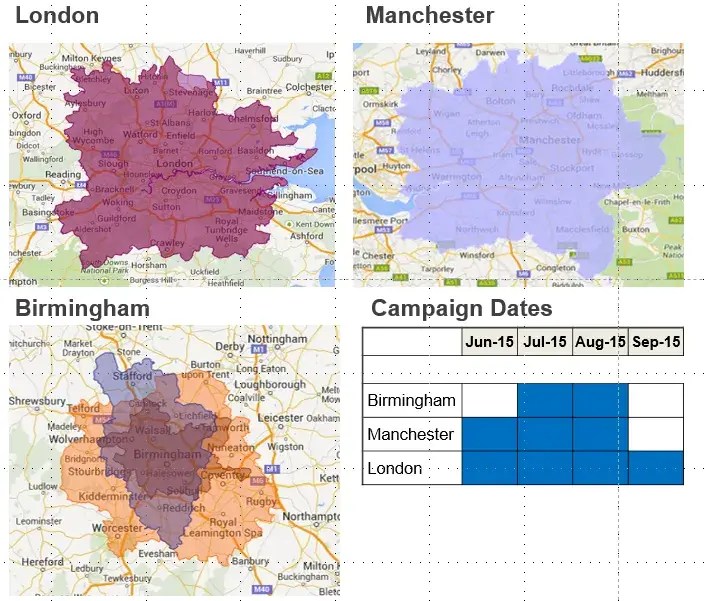
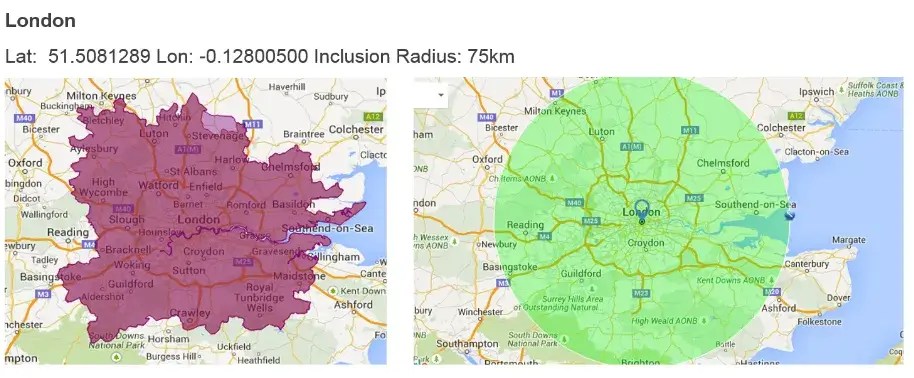
However, when we looked at the spread of the stations, we noticed that they were generally in a radius around the station itself (which stands to reason as broadcasting areas fan out reasonably evenly).
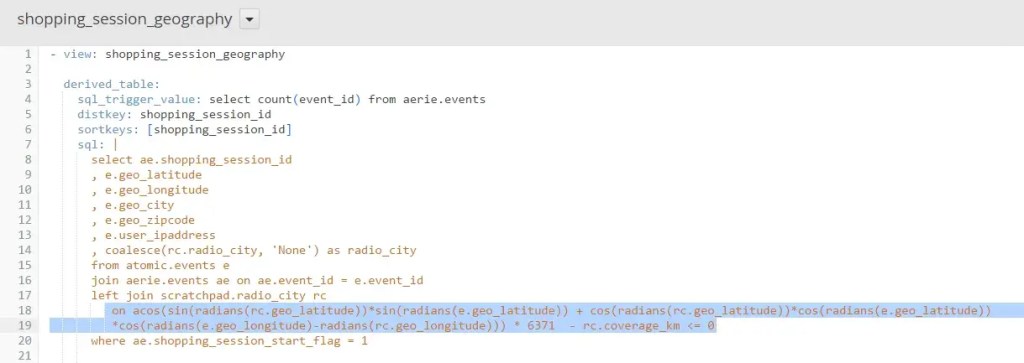
Looker provides a modelling language called LookML that works closely with traditional SQL to allow you to model your data for presentation and analysis. Noticing that we had largely circular radio reach, we did some spherical trigonometry using standard SQL to plot a radius with each station at the centre.
This LookML statement could then be associated to each visit to the site (and corresponding customer journey) so that we could segment visitors into those in earshot and those who weren’t.
The heart of our customer analysis is a funnel, modelled in Looker, that groups together each significant interaction a customer has with us, both on- and offline and also before and after purchase. We use it extensively to identify and isolate friction points where we are losing business.
The screenshot below shows how we stitch the new customised segment back into our funnel model.
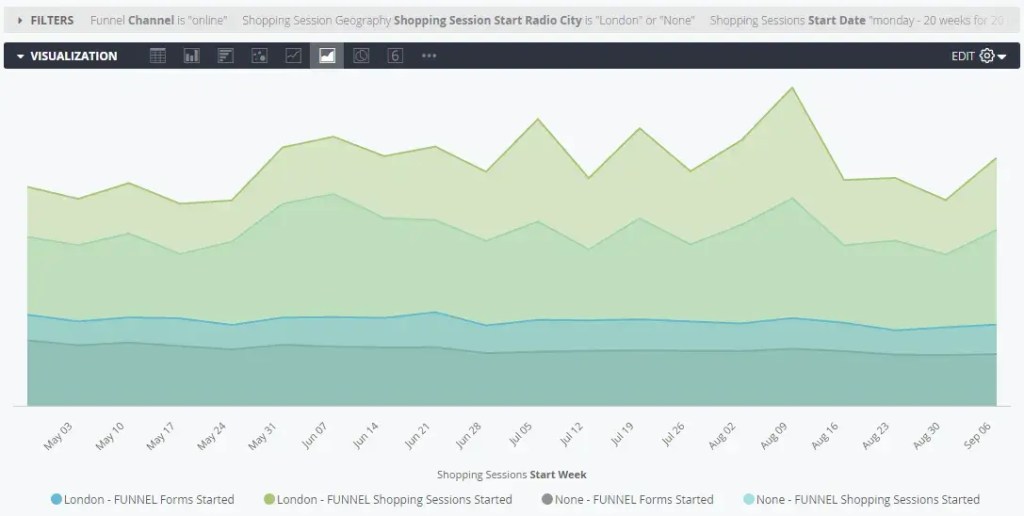
Using our new radio segments, we could track individual visitors who we were most likely acquired because of our radio campaign all the way through the purchase funnel. With some simple heuristics about the ‘decay’ of the radio influence on the direct channel, we can calculate a reasonable attribution of new revenue to that initiative, which in turn drives our radio ROI figures.
Unlike other channels, such as paid search, which typically acquire customers much further along in their purchase consideration, we expect radio to be more about driving awareness and therefore to have a longer payback period.
However, because we have our most granular visit level data, we can assign a visitor to a radio segment for perpetuity, allowing us to track and observe the behaviour of each radio segment over time – therefore validating whether brand nurturing does eventually drive positive ROI directly, alongside other measures of success such as general brand awareness and engagement.
The Outcome – Radio Moves the Needle
The Looker visualisation below shows the clear impact that our radio tests have had in each of the regions we have run them. Looking at our visitors by the marketing channel that they arrived from, we can see that our direct channel (i.e. visitors who have accessed our site by directly typing in our brand) has spiked in the days immediately following our advert being on the air. This is exactly the result we wanted.
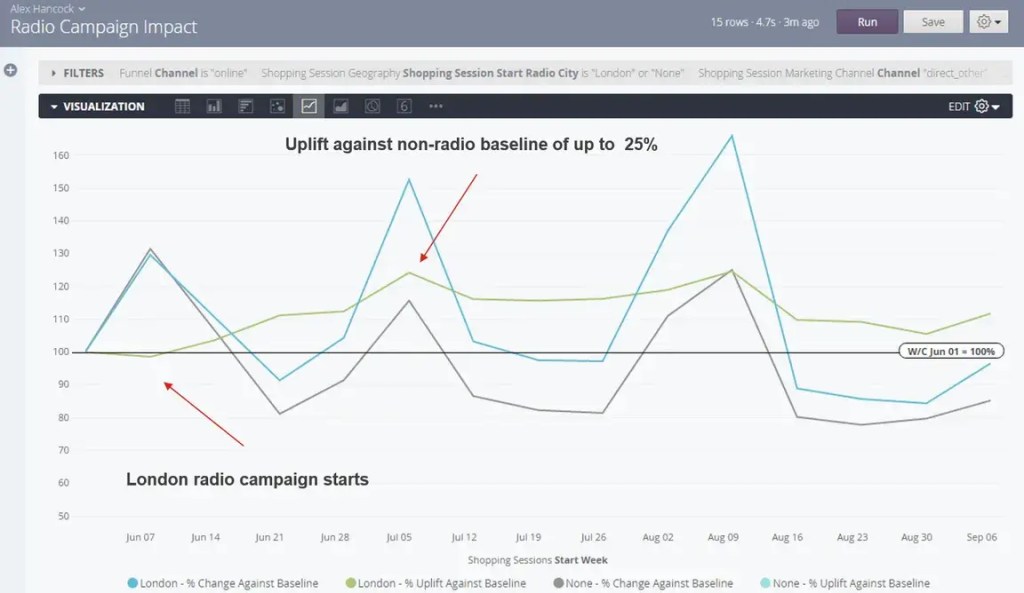
Needless to say, our Head of Brand Marketing is overjoyed with these results and has been using this insight as a basis for a business case for further investment in our radio strategy.
Wrapping up
By capturing, enriching, storing and managing the granular data from our web platform we are able to provide innovative ways of presenting and analysing customer behaviours which are not constrained by pre-defined assumptions of business need.
The foundation for this analytics success has been our events-based data platform which captures a wide range of customer interactions in a generalised but rich data structure, combined with a powerful yet agile analytics tool. Using modern cloud technologies, we are able to scale at will without needing to dedicate resources to infrastructure tuning and optimisation thereby keeping costs managed. This has offered us unprecedented levels of control over our data, allowing us to repurpose it with minimal effort and offer rapid time-to-value for marketers and others in our business.
Having proven its ability to monitor Radio advertising, a similar approach will soon be used to track the effectiveness of billboard displays.
Stewart Duncan – Director of Data Sciences Alex Hancock – Sr. Business Intelligence Analyst
Ready to start your career at Simply Business?
Want to know more about what it’s like to work in tech at Simply Business? Read about our approach to tech, then check out our current vacancies.